SEPTEMBER 2023 - STRESS HISTORY ANALYSIS
Fatigue is challenging to account for in designs due to the large amount of data processing that is required to perform such analyses. This often results in wrong shortcuts in design projects. This is the blog showcases two important steps: identifying load cycles based on time domain data.
TOPIC OF TODAY #1 - DATA PROCESSING
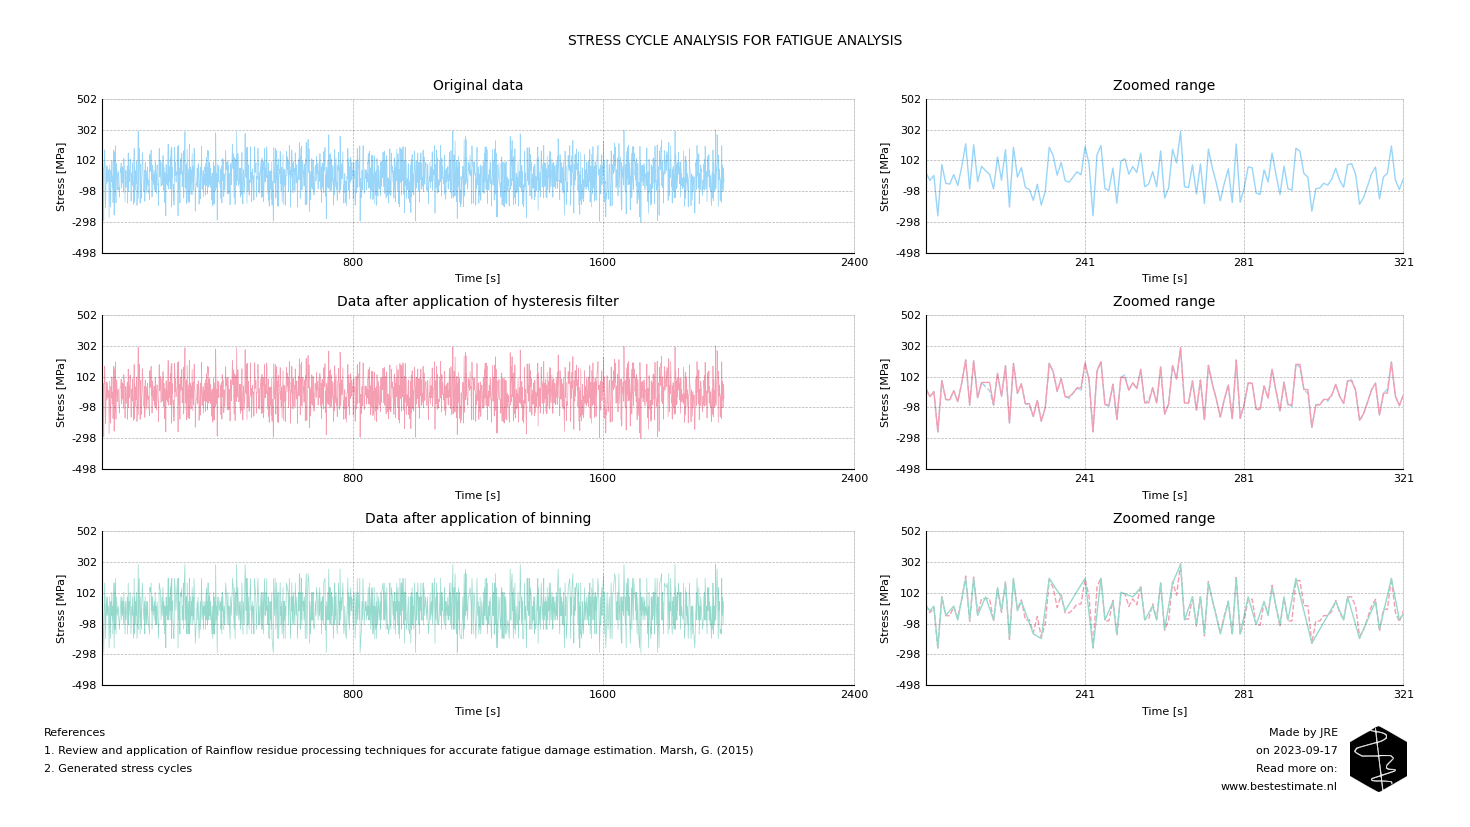
In order to perform a prediction of the lifetime of a certain component, one needs to perform a fatigue analysis. The most important input for the fatigue analysis is the number and size of cycles the object you are analyzing will or has experienced over its lifetime. You should measure the stress cycles to determine the consumed lifetime. The figure below shows stress data measured in blue. Since there might be inaccuracies or high-frequency noise in the data, we first apply a hysteresis filter, resulting in the red data. This removes fluctuations within the range of accuracy of the measurement, as visible around data point 300. Note that this does not have as big of an impact as the second filter we apply. In this step, all data is binned (in this case, in blocks of 30 MPa). This results in the green data plotted at the bottom of the figure below. The reason we do this is because it allows us to process the data more easily. The more bins you apply, the higher the accuracy of further calculations.

TOPIC OF TODAY #2 - RAINFLOW COUNTING
Of course, all the procedures above do not lead to stress cycles yet. In order to obtain these, a method called rainflow counting is applied. Rainflow counting itself is elaborated upon on countless other blogs and websites, but the most important thing is to remember the following:
- It preserves the mean of the cycle, which is important since this matters for the damage caused by the cycle
- It preserves the amplitude of the cycle, which is important as it is directly related to the damage
- It counts completed stress cycles, which is important to avoid overestimation of the amount of cycles
Rainflow counting is essential to properly estimate fatigue damage. Simply doing something like using zero-mean crossing algorithms would ignore a significant amount of damage and, thus, underpredict the lifetime of the component, potentially having disastrous consequences in real-life applications.

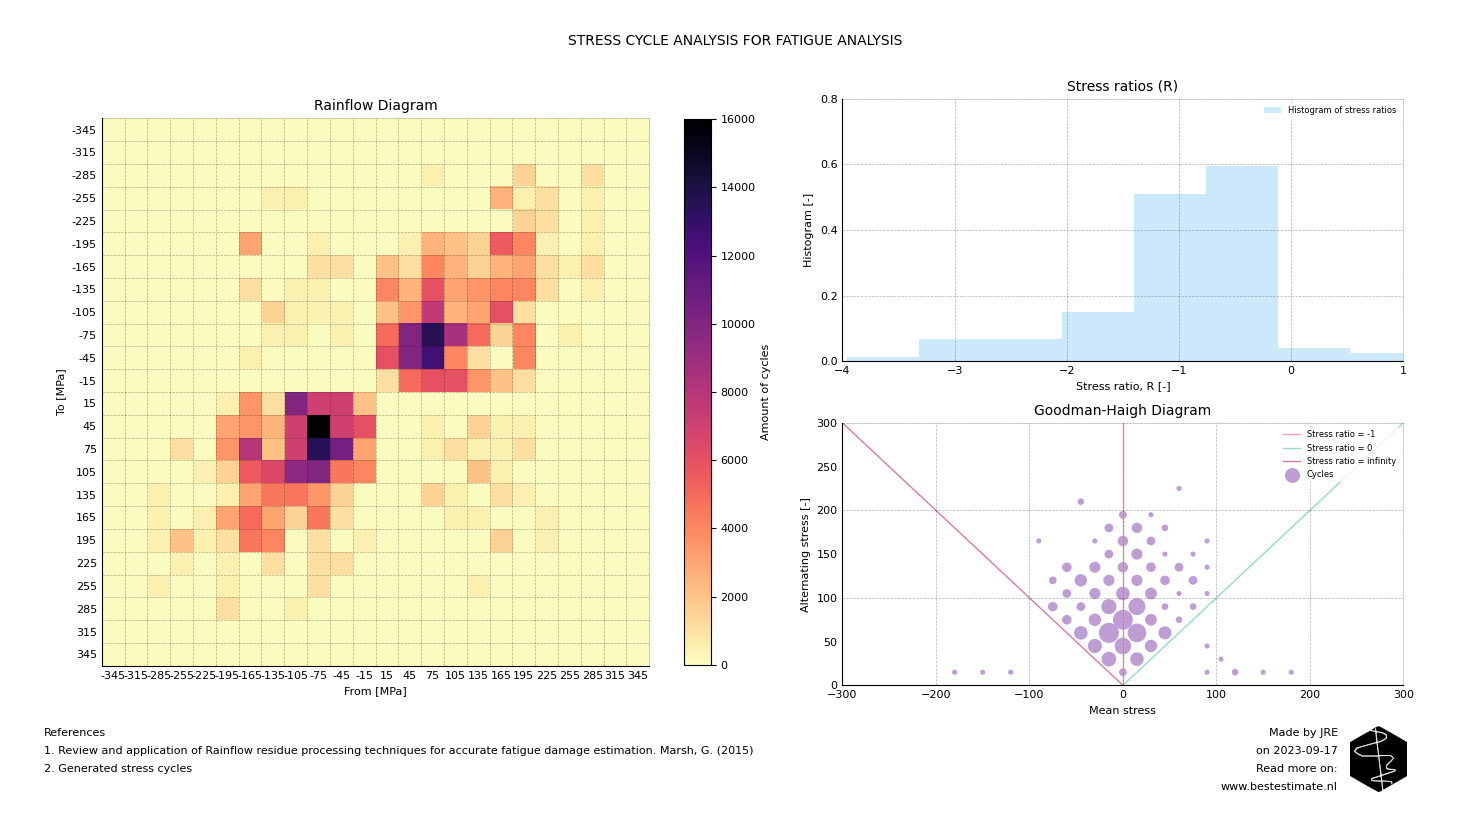
After rainflow counting has been completed one can construct a rainflow matrix displaying the amount of cycles, their amplitude and mean. This is presented in the figure above. Note the following interesting observations:
- There are many small cycles ranging between 75 MPa compression and 75 MPa tension (bottom left and top right).
- Most of the cycles fluctuate around a zero mean, but there are still cycles with non-zero means (top left and bottom right).
- There are many large cycles from tension to compression, which will result in significant fatigue damage.
Since there are cycles with non-zero means, it will be difficult to use standard S-N curves (which will be discussed in the next blog). That Is why corrections need to occur for all cycles with a stress ratio, which is the maximum stress in the cycle divided by the minimum. All non-zero stresses have to be converted to stress cycles with a zero mean. This is achieved with the Goodman-Haigh diagram displayed in the bottom right. Again, this blog will not go into depth, but it is essential to perform this correction as it ensures that:
- Compression cycles cause less damage (as elements in compression do not have a large risk of cracking)
- Tension cycles cause more damage (as elements in tension do create a motion that can cause cracks in the material)
FOOTNOTE
Please note that I run this service besides my job at TWD. It is my ambition to continuously improve this project and publish corresponding blogs on new innovations. In busy times this might be less, in quiet times this might be more. Any ideas? Let me know!
