NOVEMBER 2022 - TRUNCATED DISTRIBUTIONS
Actual physics is often forgotten in case of the application of statistics in engineering processes. A good example is the normal distribution. This can easily be used to sample impossible parameter values. This blog elaborates on truncated distributions. Truncation prevents unreasonable calculations and therefore facilitates a higher level of control by the engineer.
TOPIC OF TODAY - #1 SAMPLING ISSUES
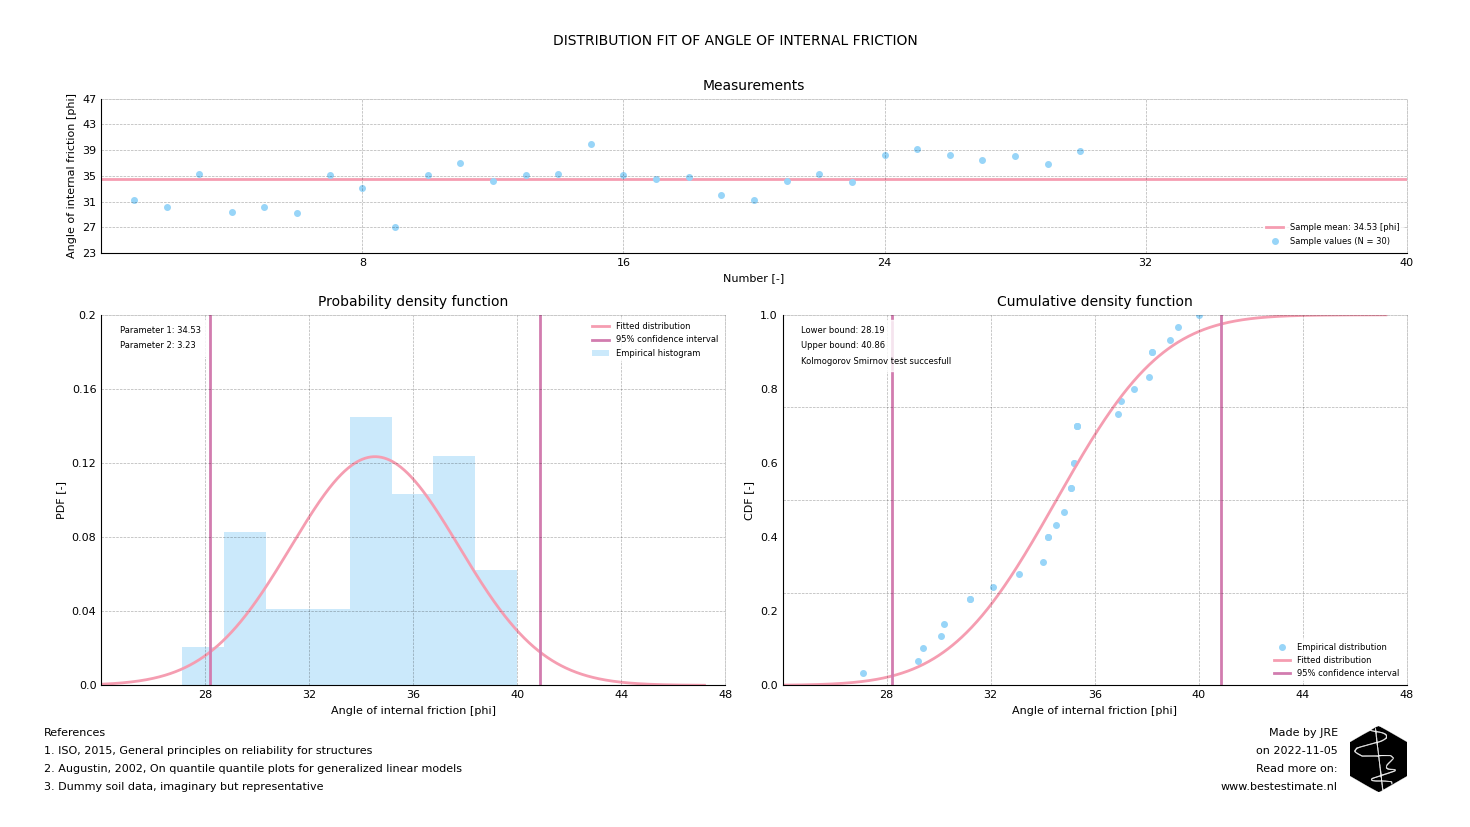
A typical example of sampling issues occurs when one wants to fit a distribution to several measurements of the angle of internal friction in sands. This parameter provides input on the shear resistance of the soil and is therefore essential for proper foundation design. Approximately 20 to 30 measurements can be available (if an engineer is lucky). As a consequence the fitted distribution (as in the figure below) has to be fitted based on limited data. This is already a much better approach than using guestimates or lower or upper bound values. Unfortunately it has one flaw. It allows for sampling of parameters from the distribution wich are phsyically impossible for typical sandy soils.

As visible above the distribution fitted implies that values below 28 and above 42 degrees are plausible for the sand type investigated. However, purely from a phsyical point of view, these values are highly unlikely. Site investigations indicate that it is neither very fine or very coarse sand. Although the impact of these tail effects seems small (only a couple of degrees) the consequences for the calculation can be large. The total shear capacity of the foundation might be under- or over-estimated by up to 15%. It is therefore important to combine professional knowledge with the statistical techniques.
TOPIC OF TODAY - #2 HOW TO SOLVE THIS
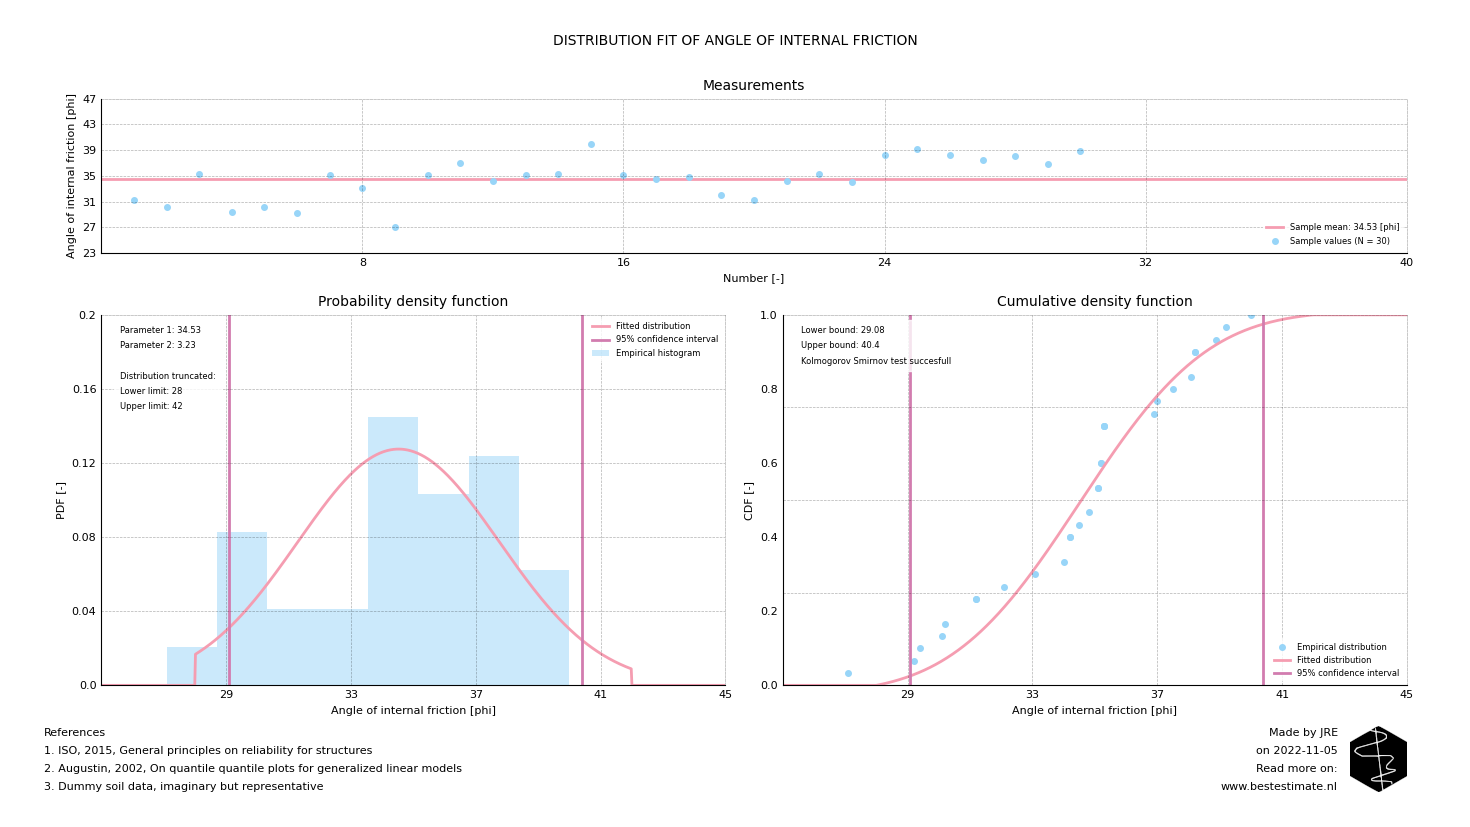
The solution is to introduce physical limitations to the distribution. By doing this, part of the distribution is cut-off (in this case the two tails). The rest of the distribution is now raised evenly to assure that the total area below the PDF curve remains equal to 1.0. Results of truncation are visible in the figure below. Can you see how the distribution changes with respect to the figure above? A truncated distribution can be used in a similar way as any other probability density function. This allows for improvements of estimations of the failure probability in Monte Carlo simulations or avoiding outliers in the simulation of random processes. The distribution fitting API endpoint is updated with this functionality and an example is provided on the open-access repository.

FOOTNOTE
Please note that I run this service besides my job at TWD. It is my ambition to continuously improve this project and publish corresponding newsletters on new innovations. In busy times this might be less, in quiet times this might be more. Any ideas? Let me know!
