MAY 2021 - JOINT VARIABILITY
Hi! Todays newsletter contains a case study and application of a reliability analysis with the API including joint variability. Also a simple showcase of the value of such an analysis is shown. This functionality is added to the API as well. It is briefly introduced in the footnote.
TOPIC OF TODAY
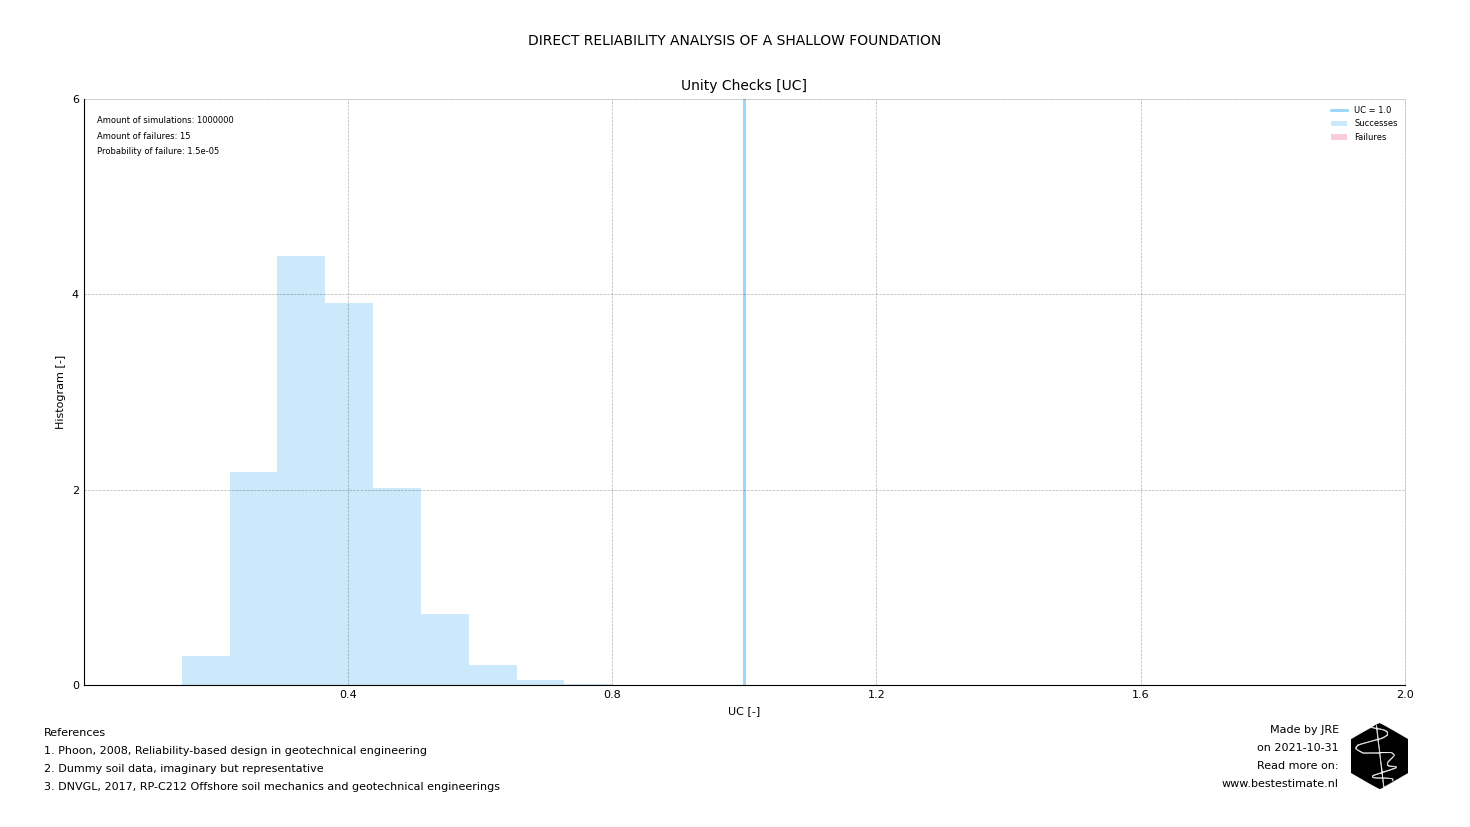
This case study concerns a comparable example as presented on the website It considers an offshore site where a temporary foundation is placed multiple times. Several measurements of soil properties were performed for different locations. The goal is to design a safe foundation based on the available loads (which vary over distance and time) and soil properties (which vary per site). First a Monte Carlo simulation is performed in which it is assumed that all variables are independent (there is no correlation). The figure below shows that there are 15 failures observed in one million simulations. A failure probability of 0.0015% is observed. The results seems pretty decent.

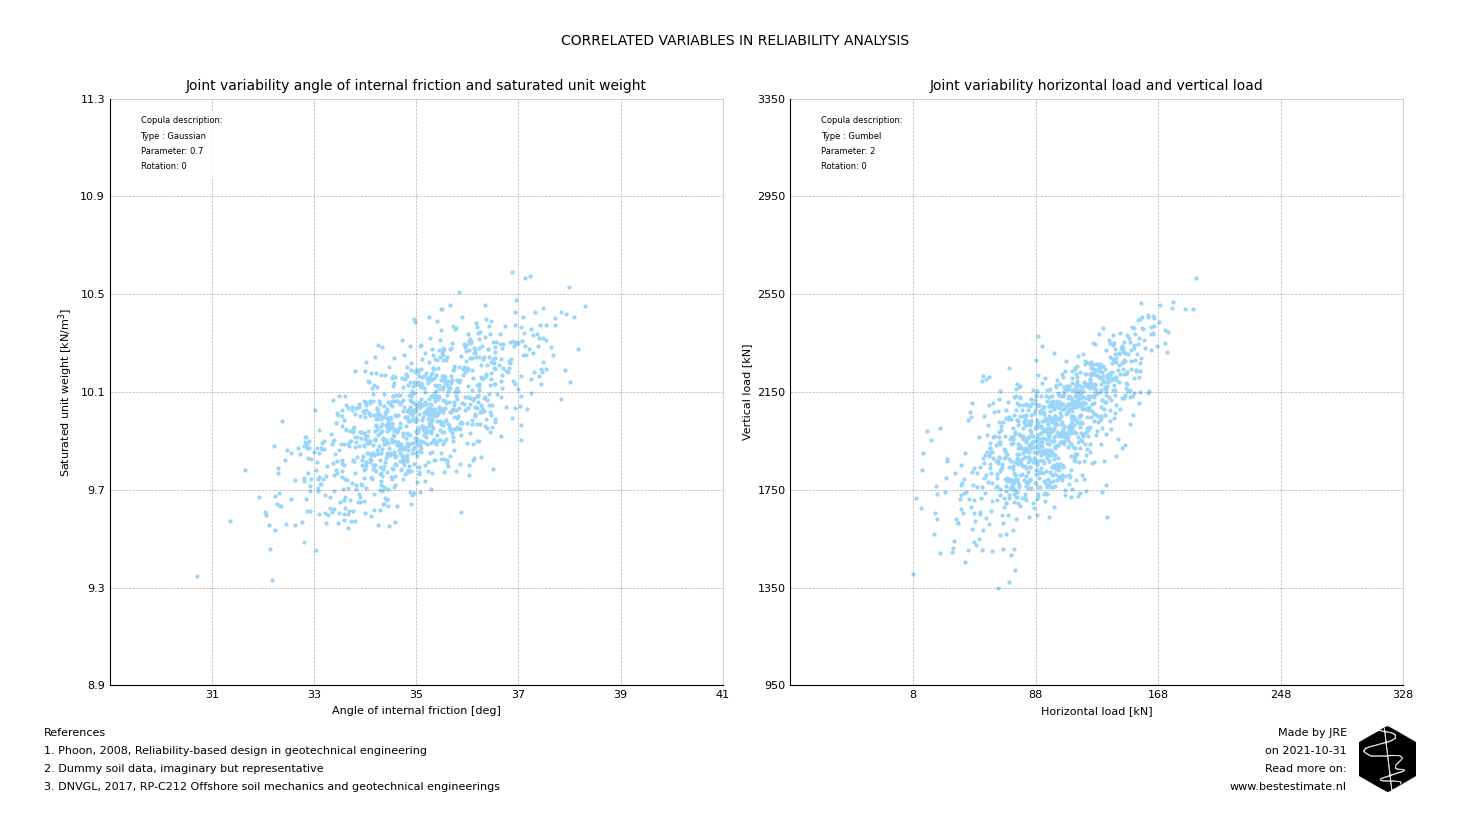
However, in reality multiple variables correlate with each other. For instance the angle of internal friction can show a relatively strong correlation with the weight of the soil, in this case it is taken as 0.7. Apart from this also the load cases are correlated. The figure below shows high horizontal loads are likely to occur simultaneously with high vertical loads. Here a more complex correlation structure is used (e.g. copulas) which will be introduced in next months newsletter. Since our normal Monte Carlo simulation assumes every parameter is independent it makes mistakes when sampling. It for instance simulates instances where low horizontal loads are combined with high vertical loads (while this is unlikely). In the API this is not anymore the case since complex correlation structures can be introduced in the analysis.

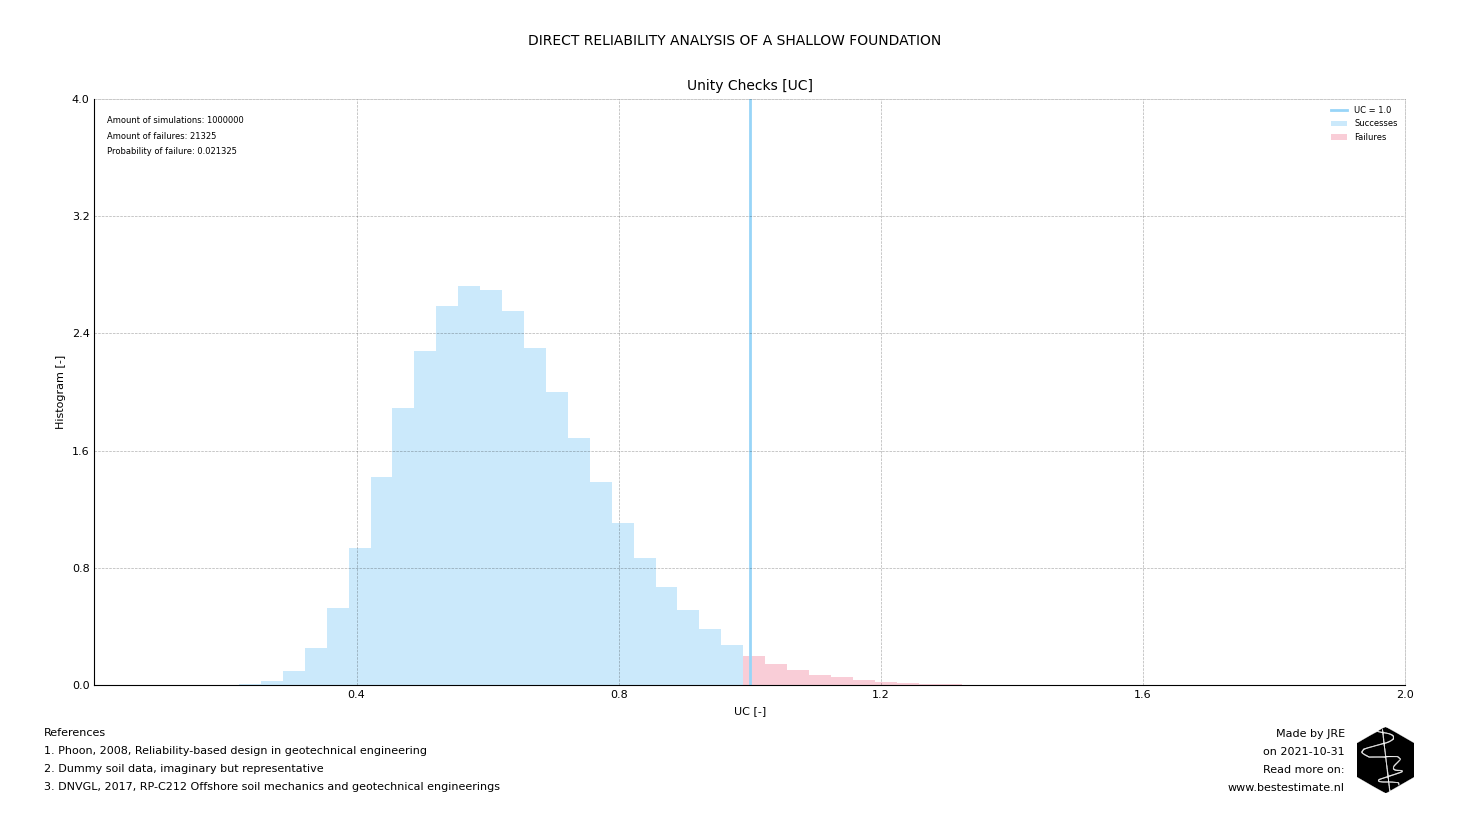
Incorporating joint variability is essential for a proper analysis of the reliability of the structure. With correlations we can actually simulate realistic scenarios where dependencies play a role. When updating the analysis the results drastically change (in this case for the worse). Now 21325 failures are observed, a probability of failure of 2.1%. Incorporating correlations can have a large effect on the outcomes of your analysis. It can either increase or reduce safety. However, understanding and implementing joint variability (if required) is key for a proper analysis.

API UPDATE #1 - CORRELATIONS IN RELIABILLITY ANALYSIS
The API is updated with the above analysis.
It is now possible to include correlations in your direct reliability analysis.
This can simply be done by adding an input line in which you tell which variables are correlated to each other (and by how much).
Please check out the public repository for an example.
Note that determining the correlation structure between two random variables and their corresponding probability density functions is a different story.
This correlation structure is incorporated in the API in the form of copulas and will be discussed in the next newsletter.
A beta description of this is already included on the public repository.
FOOTNOTE
Please note that I run this service besides my job at Temporary Works Design. It is my ambition to continuously improve this project and publish corresponding newsletters on new innovations. In busy times this might be less, in quiet times this might be more. Any ideas? Let me know!
