AUGUST 2023 - PHYSICS & STATISTICS
Statistics can be of great use in understanding when certain physical processes can occur. However, it is an absolute necessity to look at the right test statistic. This blog shows a case study on roughness profiles and displays why just using a piece of measurement equipment can be misleading.
TOPIC OF TODAY #1 - ROUGHNESS
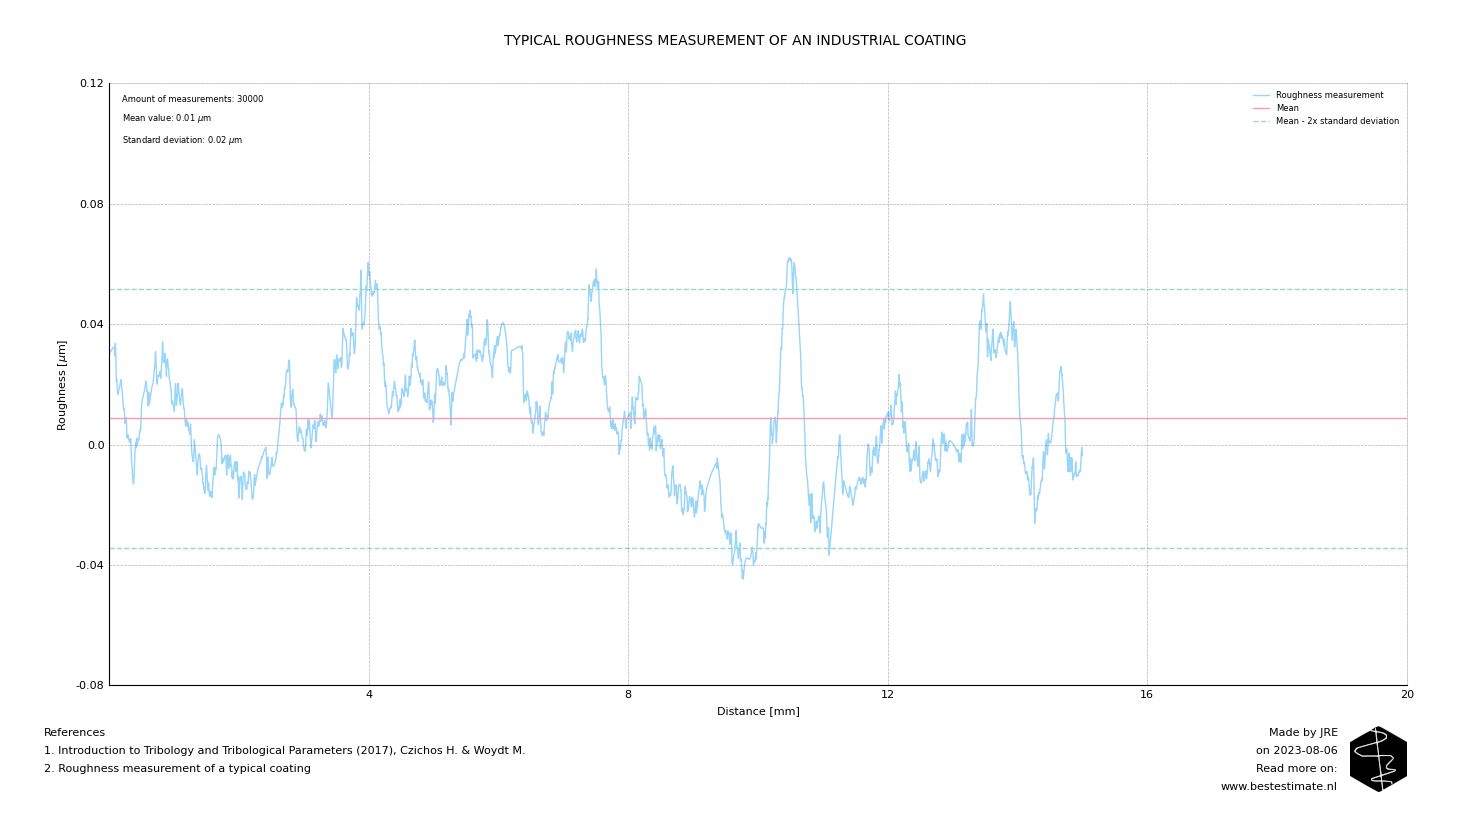
Roughness of a material can have a large impact on many operations. For example, roughness is important when applying coating to a material, having a sliding interface, and it is one of the key parameters causing wear or friction. Roughness can be measured by traveling with a small pin or laser over a material and measuring the fluctuations in depth of the material at a micro scale. In doing so, a profile is obtained as visible in the figure below. What you see is roughness measured over a distance of 15 mm. In offshore engineering, roughness is almost always prescribed by means of an Ra value. But what does this actually mean?

TOPIC OF TODAY #2 - USING THE RIGHT STATISTIC
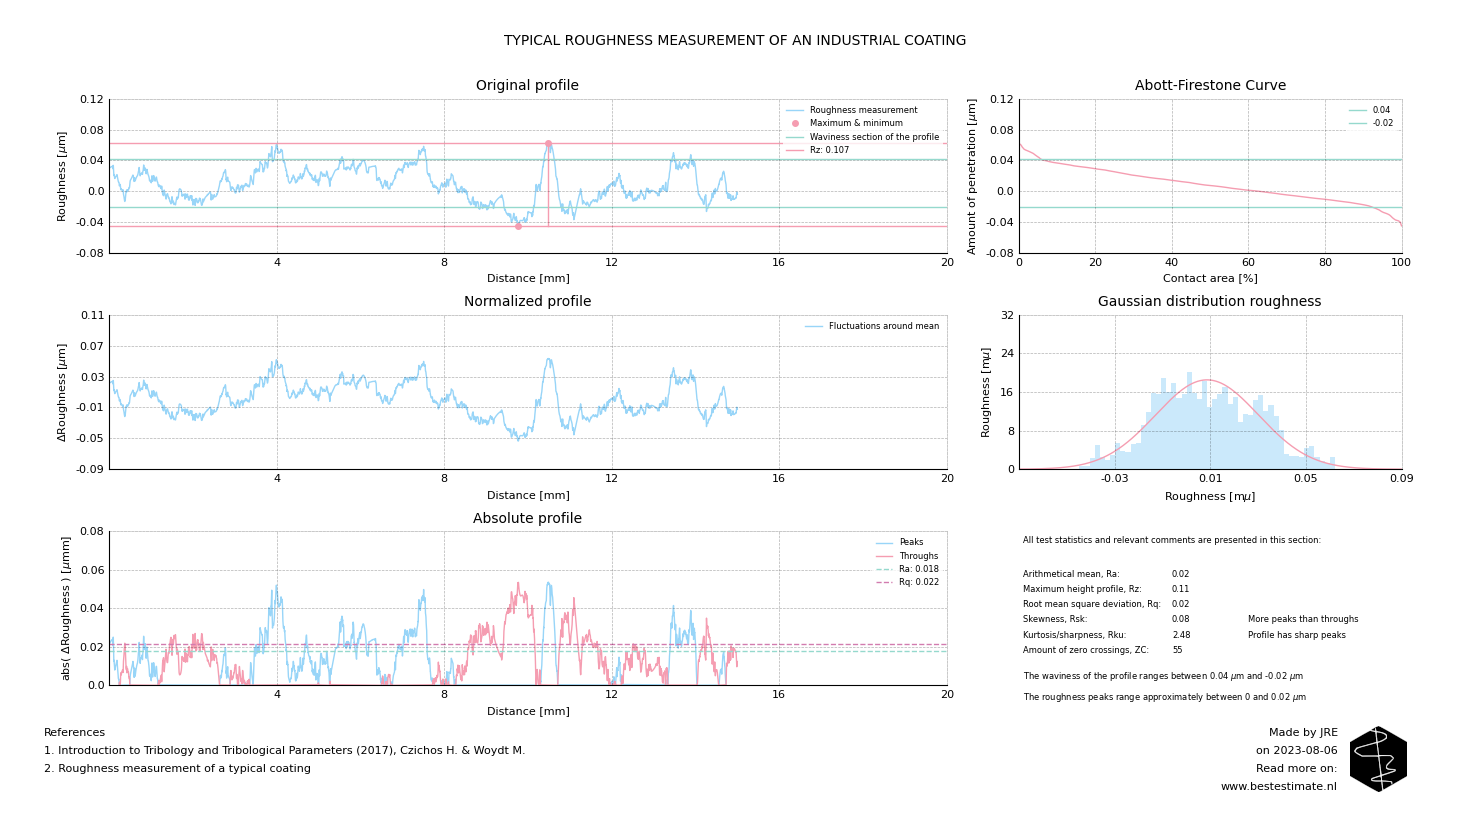
Below figure shows the deconstruction of a roughness profile into sub-profiles and several important statistics. In the top left plot, you see the profile as it was measured, including its maximum and minimum values. These are subtracted to calculate the Rz parameter. Although the Rz parameter provides some information on fluctuation, it does not offer a lot of useful information as one outlier can have an immediate effect.
Top right, you see the Abbott-Firestone curve. This curve shows how much true area of contact you have once you compress something into the roughness profile. The kinks in the curve indicate where the profile approaches its inherent waviness, and the spikes do not significantly influence the profile anymore. This is important because this waviness will often remain, even after initial wear.
In the middle, the normalized data is displayed (left, original profile - mean), and a Gaussian distribution is fitted to it (right). As you can see, the process is definitely not completely normally distributed, indicating the presence of peaks and troughs.

Understanding the shape and type of these peaks and troughs is essential. Bottom left, the absolute profile is observed where peaks are indicated in blue and troughs in red. The average of this profile is the Ra value. Note that this statistic therefore only says something about the mean of the fluctuation. However, a profile with very steep peaks can cause much more friction or wear than a profile with the same Ra value but which is nice and smooth. This is indicated by the Kurtosis parameter displayed bottom right. Additionally, a profile with a lot of peaks and few troughs can cause a lot of wear (as you can imagine). This is indicated by the Skewness parameter displayed on the bottom right. The higher above 0 the more peaks there are.
So why does this all matter? Well, if you want to grind a sample to assure bonding of a coating, you want a large area and clean contact and not necessarily a high Ra value. If you want little wear, you want a profile with a low kurtosis value, meaning it is not sharp. If you want constant performance, you want a small difference between Rz and Ra or a wavy profile. And these are only a couple of examples. The roughness profile also helps anticipate tribological parameters if you do not have any measurements available. But still, you have to look at the correct statistics for the correct physical phenomena.
FOOTNOTE
Please note that I run this service besides my job at TWD. It is my ambition to continuously improve this project and publish corresponding blogs on new innovations. In busy times this might be less, in quiet times this might be more. Any ideas? Let me know!
