AUGUST 2021 - CLUSTERING
Unfortunately it has been a while since the last update. Busy times! This is the first newsletter in series on spatial variability. Over the coming months a case study will be displayed for one typical example construction site with several CPTs performed. Once all topics have been addressed the functionality will be added to the API for use by others.
TOPIC OF TODAY
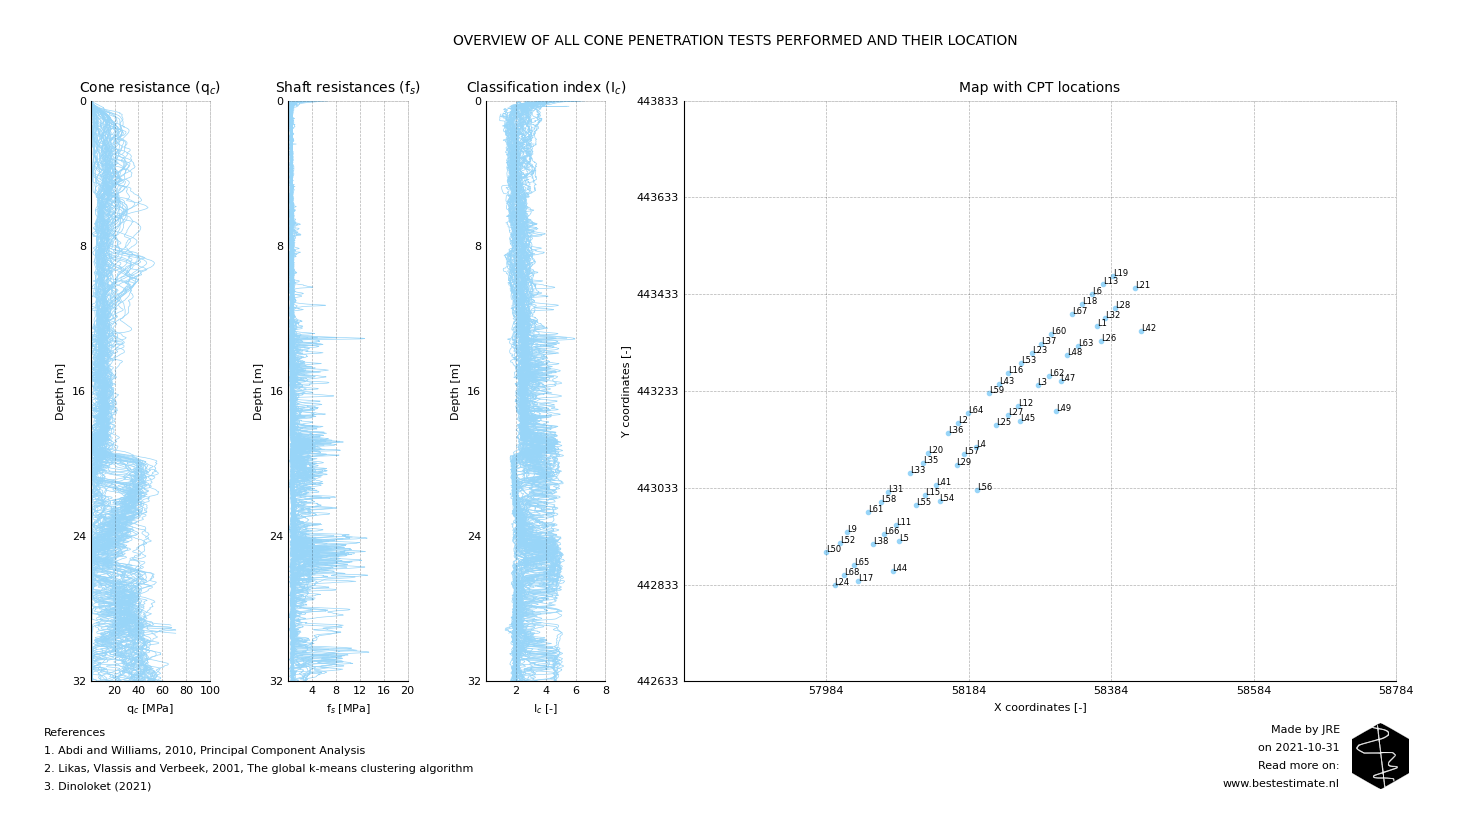
This newsletter concerns objectifying soil profile clustering by means of a Principal Component Analysis (PCA). A jetty for the mooring of ships has to be constructed at a site with varying soil conditions. The figure below displays all CPTs performed at the construction site. From the variation in the soil behavior type index (Ic) it is already clear that the profiles vary. It is neither practical nor economical to account for each location individually. Clustering could simplify:
- Design of piles, since it only has to be done for specific clusters
- Installation planning, seperate drive-ability estimates can be made which can be fine-tuned per cluster
- Speed of the design works, due to simplification of the scope of work beforehand
- Optimization of pile design due to ability to easily split the clusters

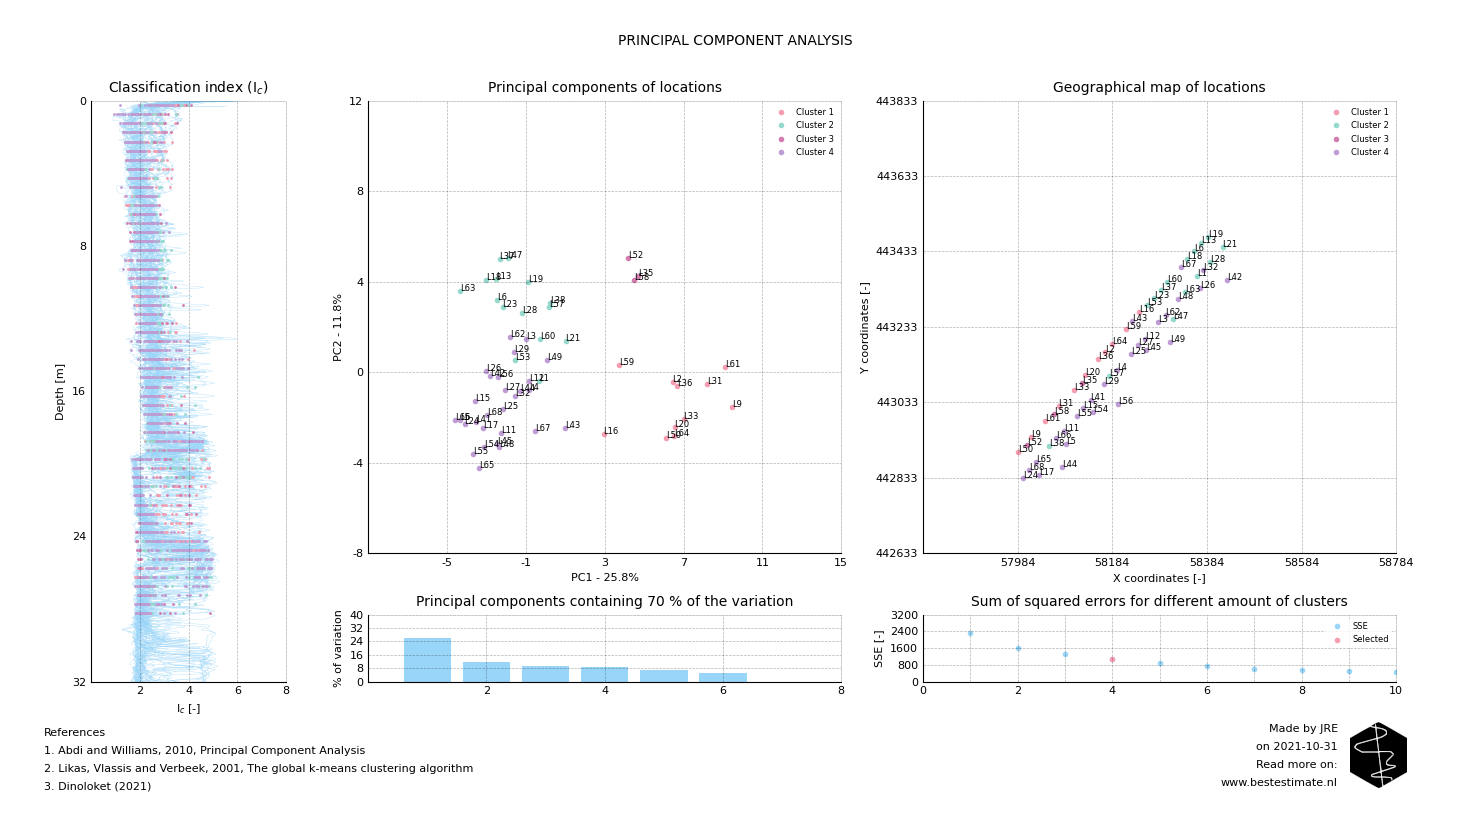
Two classic clustering algorithms are used in this study: Principal Component Analysis (PCA) and K-means clustering. Visually comparing the CPT data and clustering it is a cumbersome job which is prone to errors. PCA is often used for clustering. It reduces the amount of dimensions and simplifies the analyses without abstracting the variability too much. In this case it is performed on the classification index (Ic) over depth. After performing a PCA all locations can be plotted on a graph as visible in the figure below. An excellent explanation of PCA analyses is provided in this video as well.

The closer two points are together, the more similar these locations are. But that does not give us the clusters yet we need. K-means clustering is used to decide how much clusters are appropriate for the dataset considered. In this case four is a reasonable amount. Of course a larger or smaller amount of clusters can also be used if desired. This is up to the end user of the tool. An excellent explanation of K-means clustering is provided in this video as well. The final results of the clustering analysis can be observed below. It works quite good and is ready in seconds! Obvious differences can for instance be observed between Cluster 1 and Cluster 4 beween 20 and 30 m below seabed.
FOOTNOTE
Please note that I run this service besides my job at Temporary Works Design. It is my ambition to continuously improve this project and publish corresponding newsletters on new innovations. In busy times this might be less, in quiet times this might be more. Any ideas? Let me know!
